Texts and Tables
Texts and TablesWith CindyScript you can produce controlled and styled text for a drawing. The essential functionality is covered by the drawtext operator. Furthermore, with drawtable a table output can be generated. Using texts and tables in scripts is very useful, since one can use the script language to control when and where text is displayed in a construction. This is a very important tool for providing explanatory texts and functional exercises that react to input.Drawing Text:
|
| Modifier | Parameter | Effect |
size | <real> | sets the text size |
color | [<real>,<real>,<real>] | sets the text color |
alpha | <real> | sets the text opacity |
xoffset | <real> | set an x offset in pixels between text and base point |
yoffset | <real> | set a y offset in pixels between text and base point |
offset | [<real>,<real>] | set an xy offset in pixels between text and base point |
align | "left", "right", "mid" | determines where the text alignment should be |
bold | <bool> | flag for bold text |
italics | <bool> | flag for italics text |
family | <string> | specifying the font family |
Besides the available font families also the three strings
serif, sansserifand
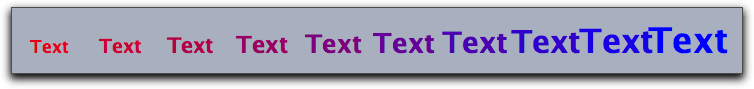
monospaced are allowed, that always produce corresponding standard font types.Example: The code
x=1..10;
forall(x,i,
  drawtext((i,0),"Text",
  size->2*i+15,
  bold->true,
  color->(1-i/10,0,i/10))
)
produces the picture below.
 |
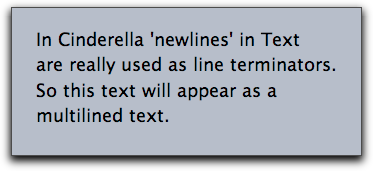
If the string expression contains a <newline> chacracter then this line-break is literally interpreted. By this it is easy to produce multilined text, as the following piece of code shows.
drawtext((0,0),size->18,
"In Cinderella 'newlines' in Text
are really used as line terminators.
So this text will appear as a
multilined text.")
 |
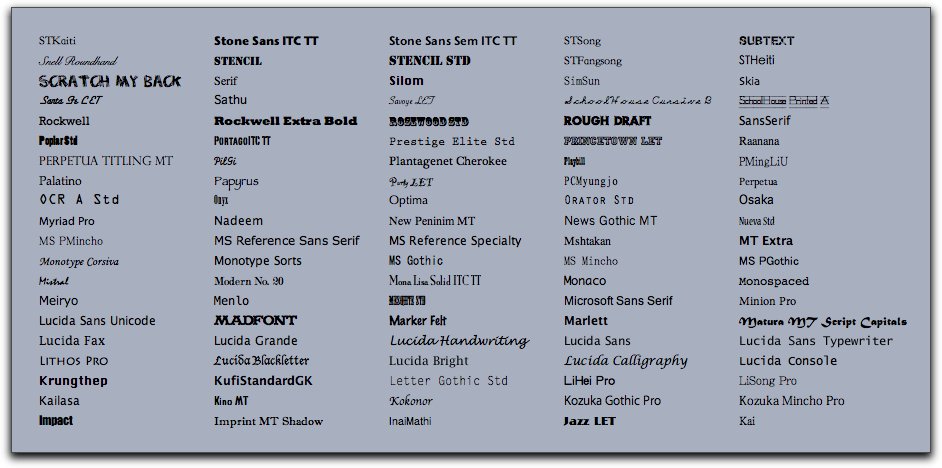
Available font families: fontfamilies()
Description: This operator produces a list of all font families that are available on your computer. Usually this will be quite a lot. The following piece of code displays the names of some of these font families in their own font style.
families=fontfamilies();
i=0;
while(length(families)>i,i=i+1;
   drawtext((mod(i,5)*7,round(i/5)),families_i,family->families_i);
)
 |
Unicode Characters: unicode(<string>)
Description: Cinderella can display any Unicode Character in text strings. To access a unicode character the statement
unicode(<string>) accepts a unicode description (a number) given as a string of digits. It returns a string with the corresponding unicode character. By default the base of the unicode description is 16. So hexadecimal descriptions are usually accepted as input. The base can be changed by a modifier.The base of the unicode description can be changed with the
base modifier.Example: Both
unicode("0041") and unicode("65",base->10) produce the character "A".Test whether a string can be displayed: candisplay(<string>)
Description: This operator tests, whether a given string can be displayed in the currently chosen font. It returns a boolean value.
Drawing tables: drawtable(<vec>,<list>)
One- and two-dimensional lists can be easily drawn in a geometric view as tables. In the simplest form one has only to provide the list and a position where the table should be drawn. Modifiers can be used to fine tune the appearance of the table.
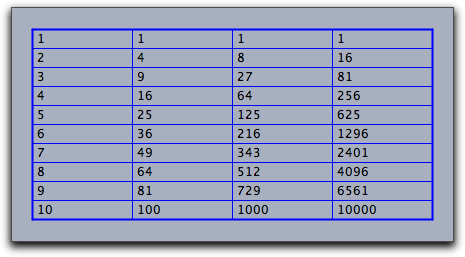
Example: The following code produces the picture below:
x=1..10;
table=apply(x,(#,#^2,#^3,#^4));
drawtable((0,0),table);
 |
Modifiers: The
drawtable operator supports several modifiers to control the graphical appearance of the table. A summary of the modifiers is given in the following table:| Modifier | Parameter | Effect |
width | <int> | the width of the cells in pixels |
height | <int> | the width of the cells in pixels |
flip | | exchanges the role of rows and columns |
border | <bool> | turns on/off drawing of lines and borders |
size | <real> | sets the text size |
color | [<real>,<real>,<real>] | sets the text color |
alpha | <real> | sets the text opacity |
offset | [<real>,<real>] | sets an xy offset in pixels between text and base point |
align | "left", "right", "mid" | determines the horizontal text alignment within a cell |
back | <bool> | turns on/off the drawing of a table background |
back | [<real>,<real>,<real>] | turns on the drawing of table background and sets it to an RGB color |
backalpha | <real> | sets opacity of the table background |
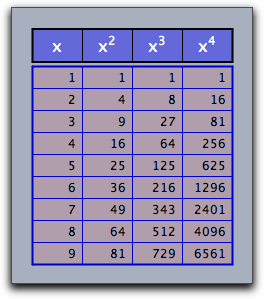
Example: The following code is a more elaborate example using the
drawtable operator. modifiers are used to create a nice appearance of the tables. A second table is used to create a heading for the table.
x=1..9;
tab=apply(x,(#,#^2,#^3,#^4));
tab1=("x","$x^2$","$x^3$","$x^4$");
linecolor((0,0,.8));
drawtable((0,0),tab,
  width->50,
  height->22,
  back->(1,0,0),
  backalpha->0.1,
  align->"right",
  size->12
);
linecolor((0,0,0));
drawtable((0,8.1),tab1,flip->true,
  width->50,
  height->33,
  back->(0,0,1),
  backalpha->0.4,
  align->"mid",
  size->16,
  color->(1,1,1)
);
 |
Contributors to this page: Wurster
,
Kortenkamp
and
Akira Iritani
.
Page last modified on Thursday 10 of July, 2014 [08:12:09 UTC] by Wurster.
The content on this page is licensed under the terms of the License.
Login